colours that R knows
By Jen Richmond
December 14, 2022
I have been working through the
ggplot R Advent calendar by Kiirsti Owen with some lovely RLadies friends and we got up to Day 15 where we started controlling colours in ggplot with scale_fill_manual(). Our immediate question was “how to you know what the names of the colours that R knows are?”
This is a “I don’t have to google” post about finding the colours that R knows about.
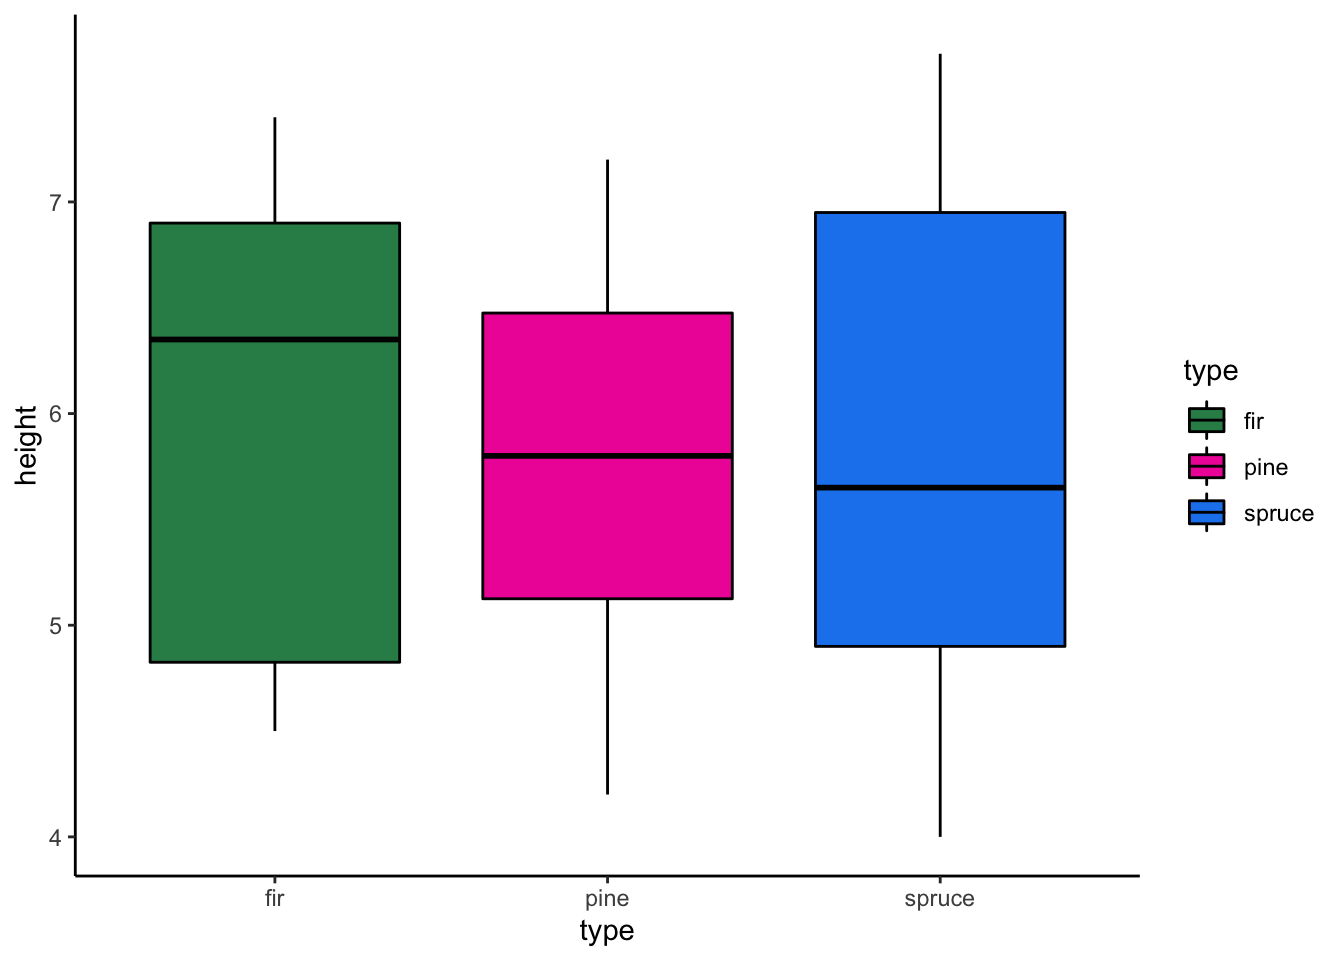
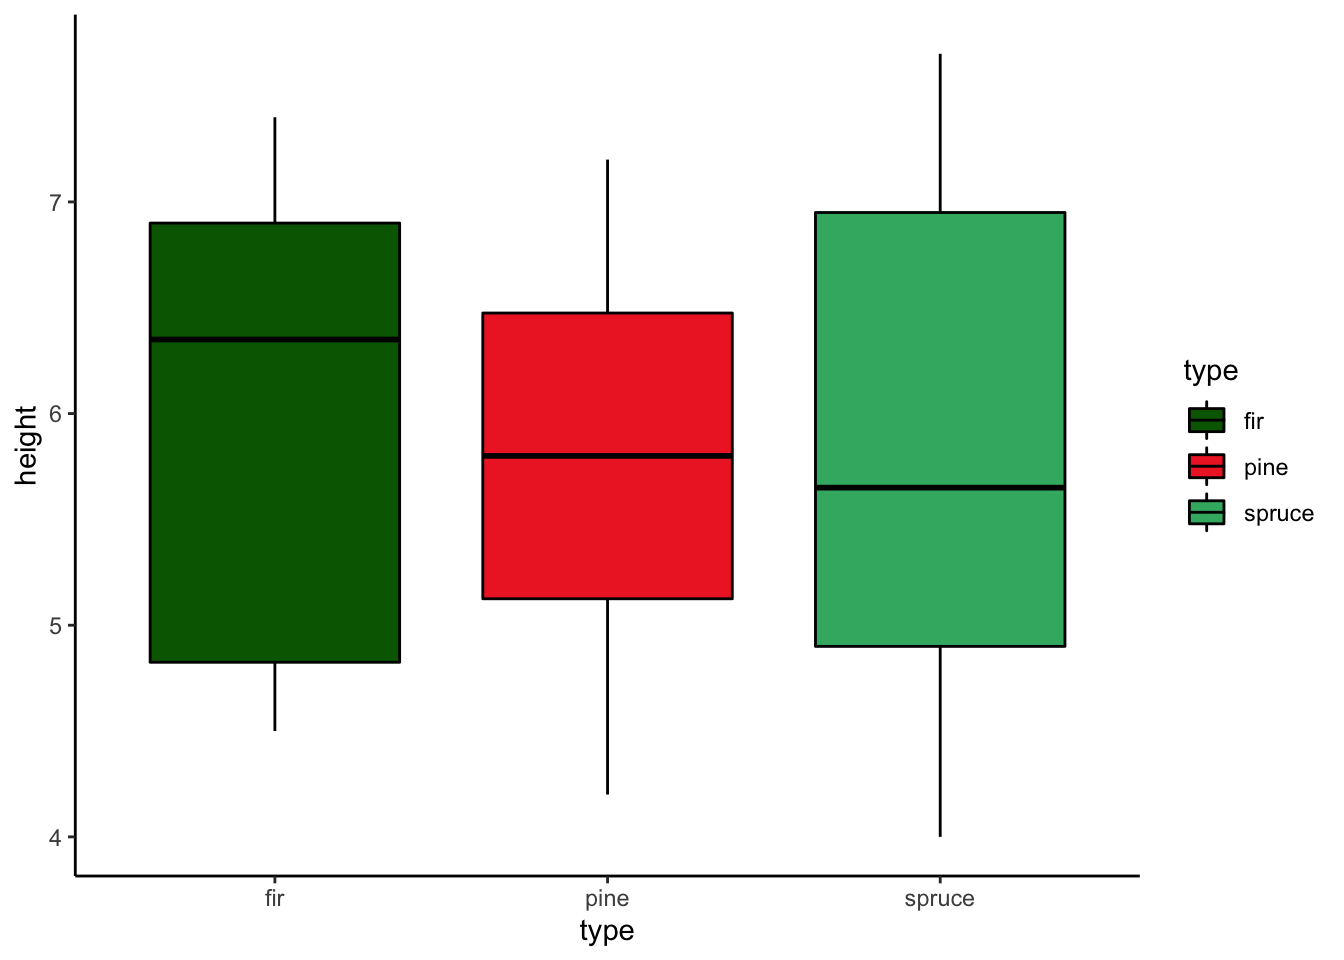
trees %>%
ggplot(aes(x=type, y=height))+
  geom_boxplot(aes(fill=type), colour="black")+
  theme_classic()+
  scale_fill_manual(values=c("darkgreen", "firebrick2", "mediumseagreen"))
You can have R list the names of all the colours it knows (there are 657 of them) using the colours() function, but that is not so useful if you want to see the difference between hotpink1 and hotpink2.
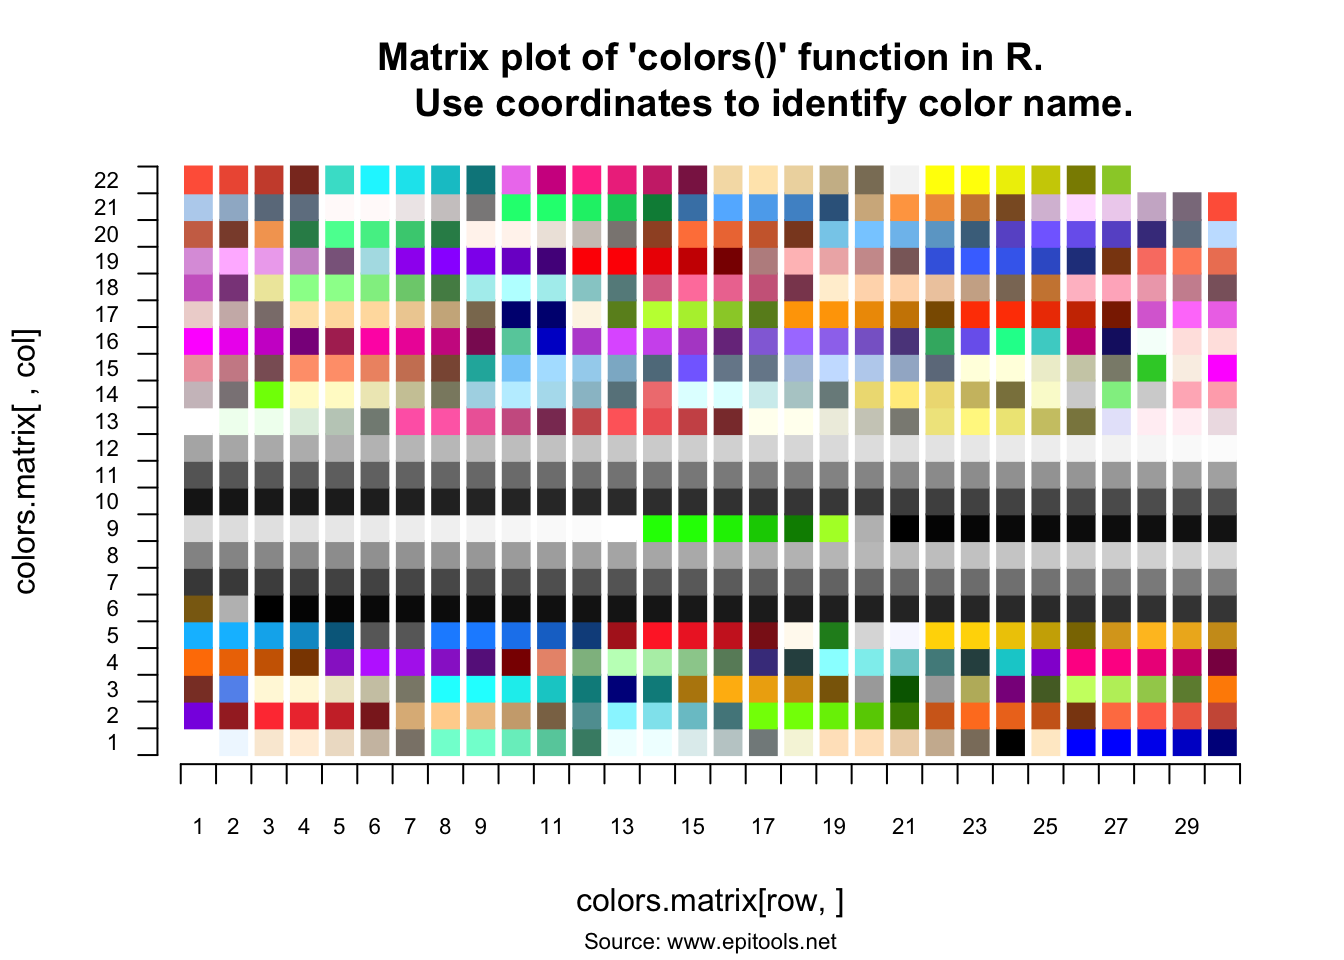
We eventually found a function in the epitools package that will display all the colours and allow you to point a click the ones you want! It doesn’t work so well in an Rmd chunk- you are best to try it in the console.
# install.packages("epitools")

library(epitools)

colors.plot(locator = TRUE)
## [1] color.names
## <0 rows> (or 0-length row.names)
Load the epitools package and then use the colors.plot() function in the console, setting locator = TRUE. A matrix will appear in your Plots tab. You can use your mouse to pick the colours you want and then click Finish to have R print the names of those colours to your console.
You can then use those names to revise your plot colours.
trees %>%
ggplot(aes(x=type, y=height))+
  geom_boxplot(aes(fill=type), colour="black")+
  theme_classic()+
  scale_fill_manual(values=c("seagreen", "maroon2", "dodgerblue2"))