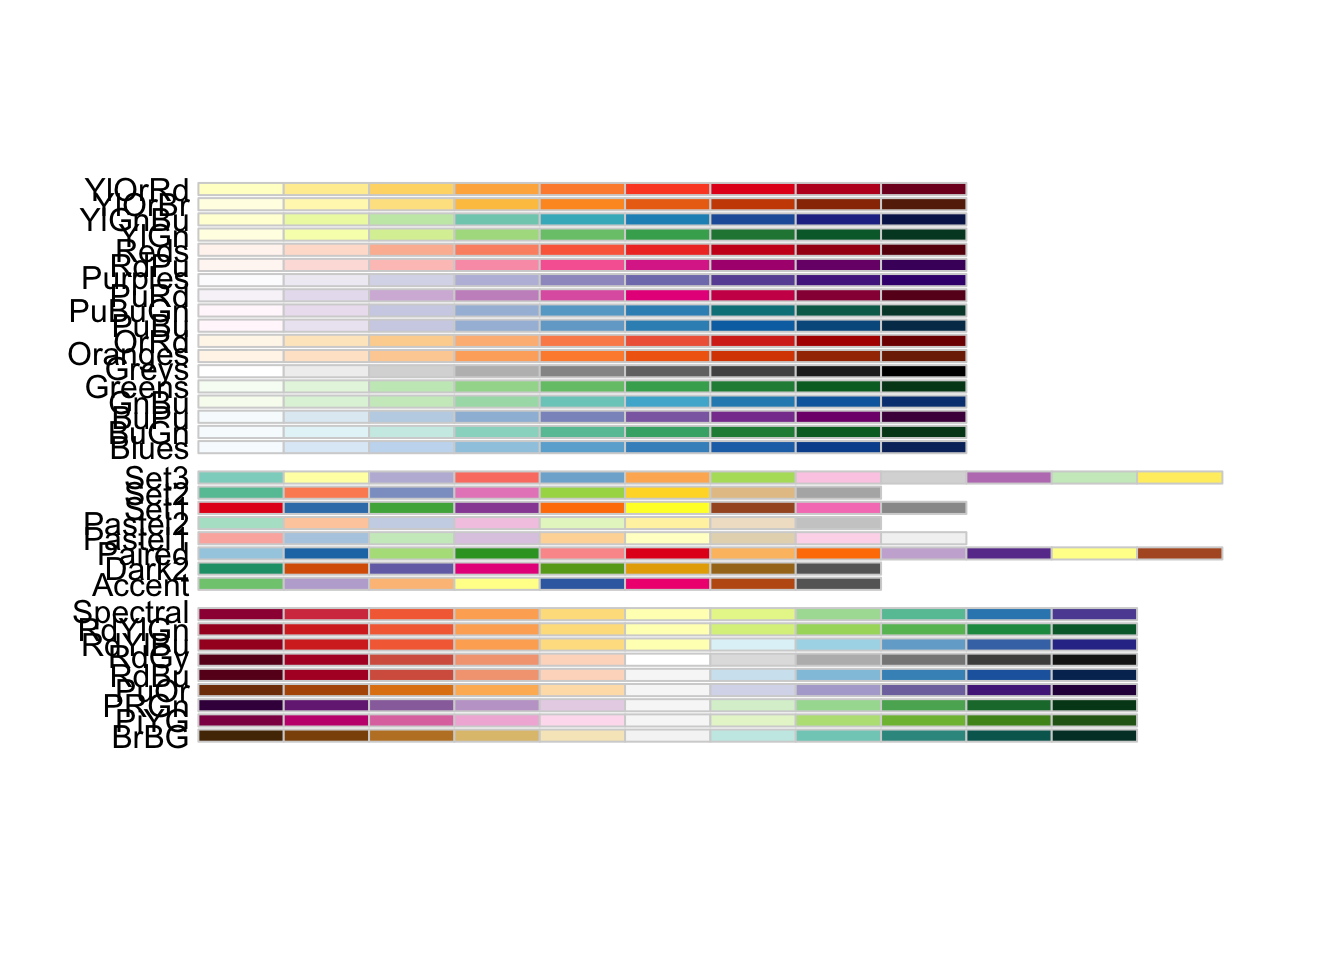
how to use colour palettes with ggplot

Series: IDHTG

If I had a dollar for everytime I have googled how to change the colours in my ggplot…it is clearly time for a “I don’t have to google” post about it. library(tidyverse) library(palmerpenguins) library(RColorBrewer) library(harrypotter) penguins <- penguins make a couple of basic plots When dealing with geom_point(), you can use colour to change the colour of the points. For geom_col(), you need to use fill; colour will change the border around your bars.

how to annotate plots

Series: IDHTG

A new post in my I Don’t Have to Google (IDHTG) series. I’ve been wanting to work out how to add annotations to plots for a while and this plot from the @WeAreRladies account this week got me inspired! I also looked at activity by week. You can see that there are some weeks when there was a break between curators. You can also see curators are totally different - both in terms of number of tweets and the number of retweets and replies.

recoding variables

Series: IDHTG

I don’t often deal with questionnaire data in R, but Ariana and I have started trying import her qualtrics data into R and to write a script to score her measures. The first step is to recode the variables to make it possible to add up scores on subscales. load packages library(tidyverse) make a little dataframe df <- data.frame("pp_no" = 1:12, "sectionA_1" = c("Strongly Agree","Agree", "Disagree","Strongly Disagree"), "sectionA_2" = c("Strongly Agree","Agree", "Disagree","Strongly Disagree"), "sectionB_1" = c("Frequently","Sometimes", "Infrequently"), "sectionB_2" = c("Frequently","Sometimes", "Infrequently")) Option 1: use mutate() and case_when() My first intuition is to use case_when(), which I have written about before.

in dplyr

February 8, 2020

counting things

Series: IDHTG

Sometimes things that are really easy to do in excel are not so intuitive in R. Like counting things. Because most of the time I am working with data in long format, you can end up with hundreds of observations, so functions like length() aren’t useful. Today I just wanted to check how many participants were in this dataset and it took me some significant googling. load packages library(tidyverse) library(ggbeeswarm) library(janitor) create a little df df <- data.

working with factors

Series: IDHTG

I use read_csv to read data into R and it most conservatively assumes that when you have text in a variable you are dealing characters (not factors). Of course these things are often factors so you need to explicitly convert them if you want to use the factor in an analysis or have it appear the way you want in a ggplot. The forcats package will do this with as_factor