my first pull request

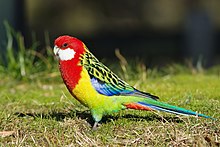
There are so many lovely packages for colour palettes (see links at the bottom of this post for more). This new one called feather by Shandiya Balasubramanium is inspired by Australian birds and is delightful. Today I built my first R package! Meet feather: a set of colour palettes inspired by the plumage of Australian birds. It's a work in progress and a bit rough around the edges, but I'm pretty proud of it#RStats #WildOz #DataVisualization https://t.

January 8, 2021

functions to save you time

Last year my R resolution was to google less. I think I succeeded (kinda). I wrote a few posts in my IDHTG series. counting things recoding variable work with factors annotating plots use colour palettes I don’t necessary remember exactly how to recode variables or to make factors behave, but I know I have notes in my blog about those things to refer to, so that makes the googling much faster.

cleaning penguins with the janitor package

The janitor package by Sam Firke contains probably my FAVOURITE R function: clean_names(). By default when I am reading data into R, I pipe clean_names() onto the end of my read_csv(). I never have to look at inconsistently formatted variable names. But janitor package includes lots of other useful functions that make it easier to deal with dirty data and count stuff. new_df <- read_csv(here("data", "df.csv") %>% clean_names()) Exploring package functions Are you keen to dig into the little known functions of a package that you use all the time?

how to use colour palettes with ggplot

Series: IDHTG

If I had a dollar for everytime I have googled how to change the colours in my ggplot…it is clearly time for a “I don’t have to google” post about it. library(tidyverse) library(palmerpenguins) library(RColorBrewer) library(harrypotter) penguins <- penguins make a couple of basic plots When dealing with geom_point(), you can use colour to change the colour of the points. For geom_col(), you need to use fill; colour will change the border around your bars.

how to annotate plots

Series: IDHTG

A new post in my I Don’t Have to Google (IDHTG) series. I’ve been wanting to work out how to add annotations to plots for a while and this plot from the @WeAreRladies account this week got me inspired! I also looked at activity by week. You can see that there are some weeks when there was a break between curators. You can also see curators are totally different - both in terms of number of tweets and the number of retweets and replies.