lubridate characters to dates

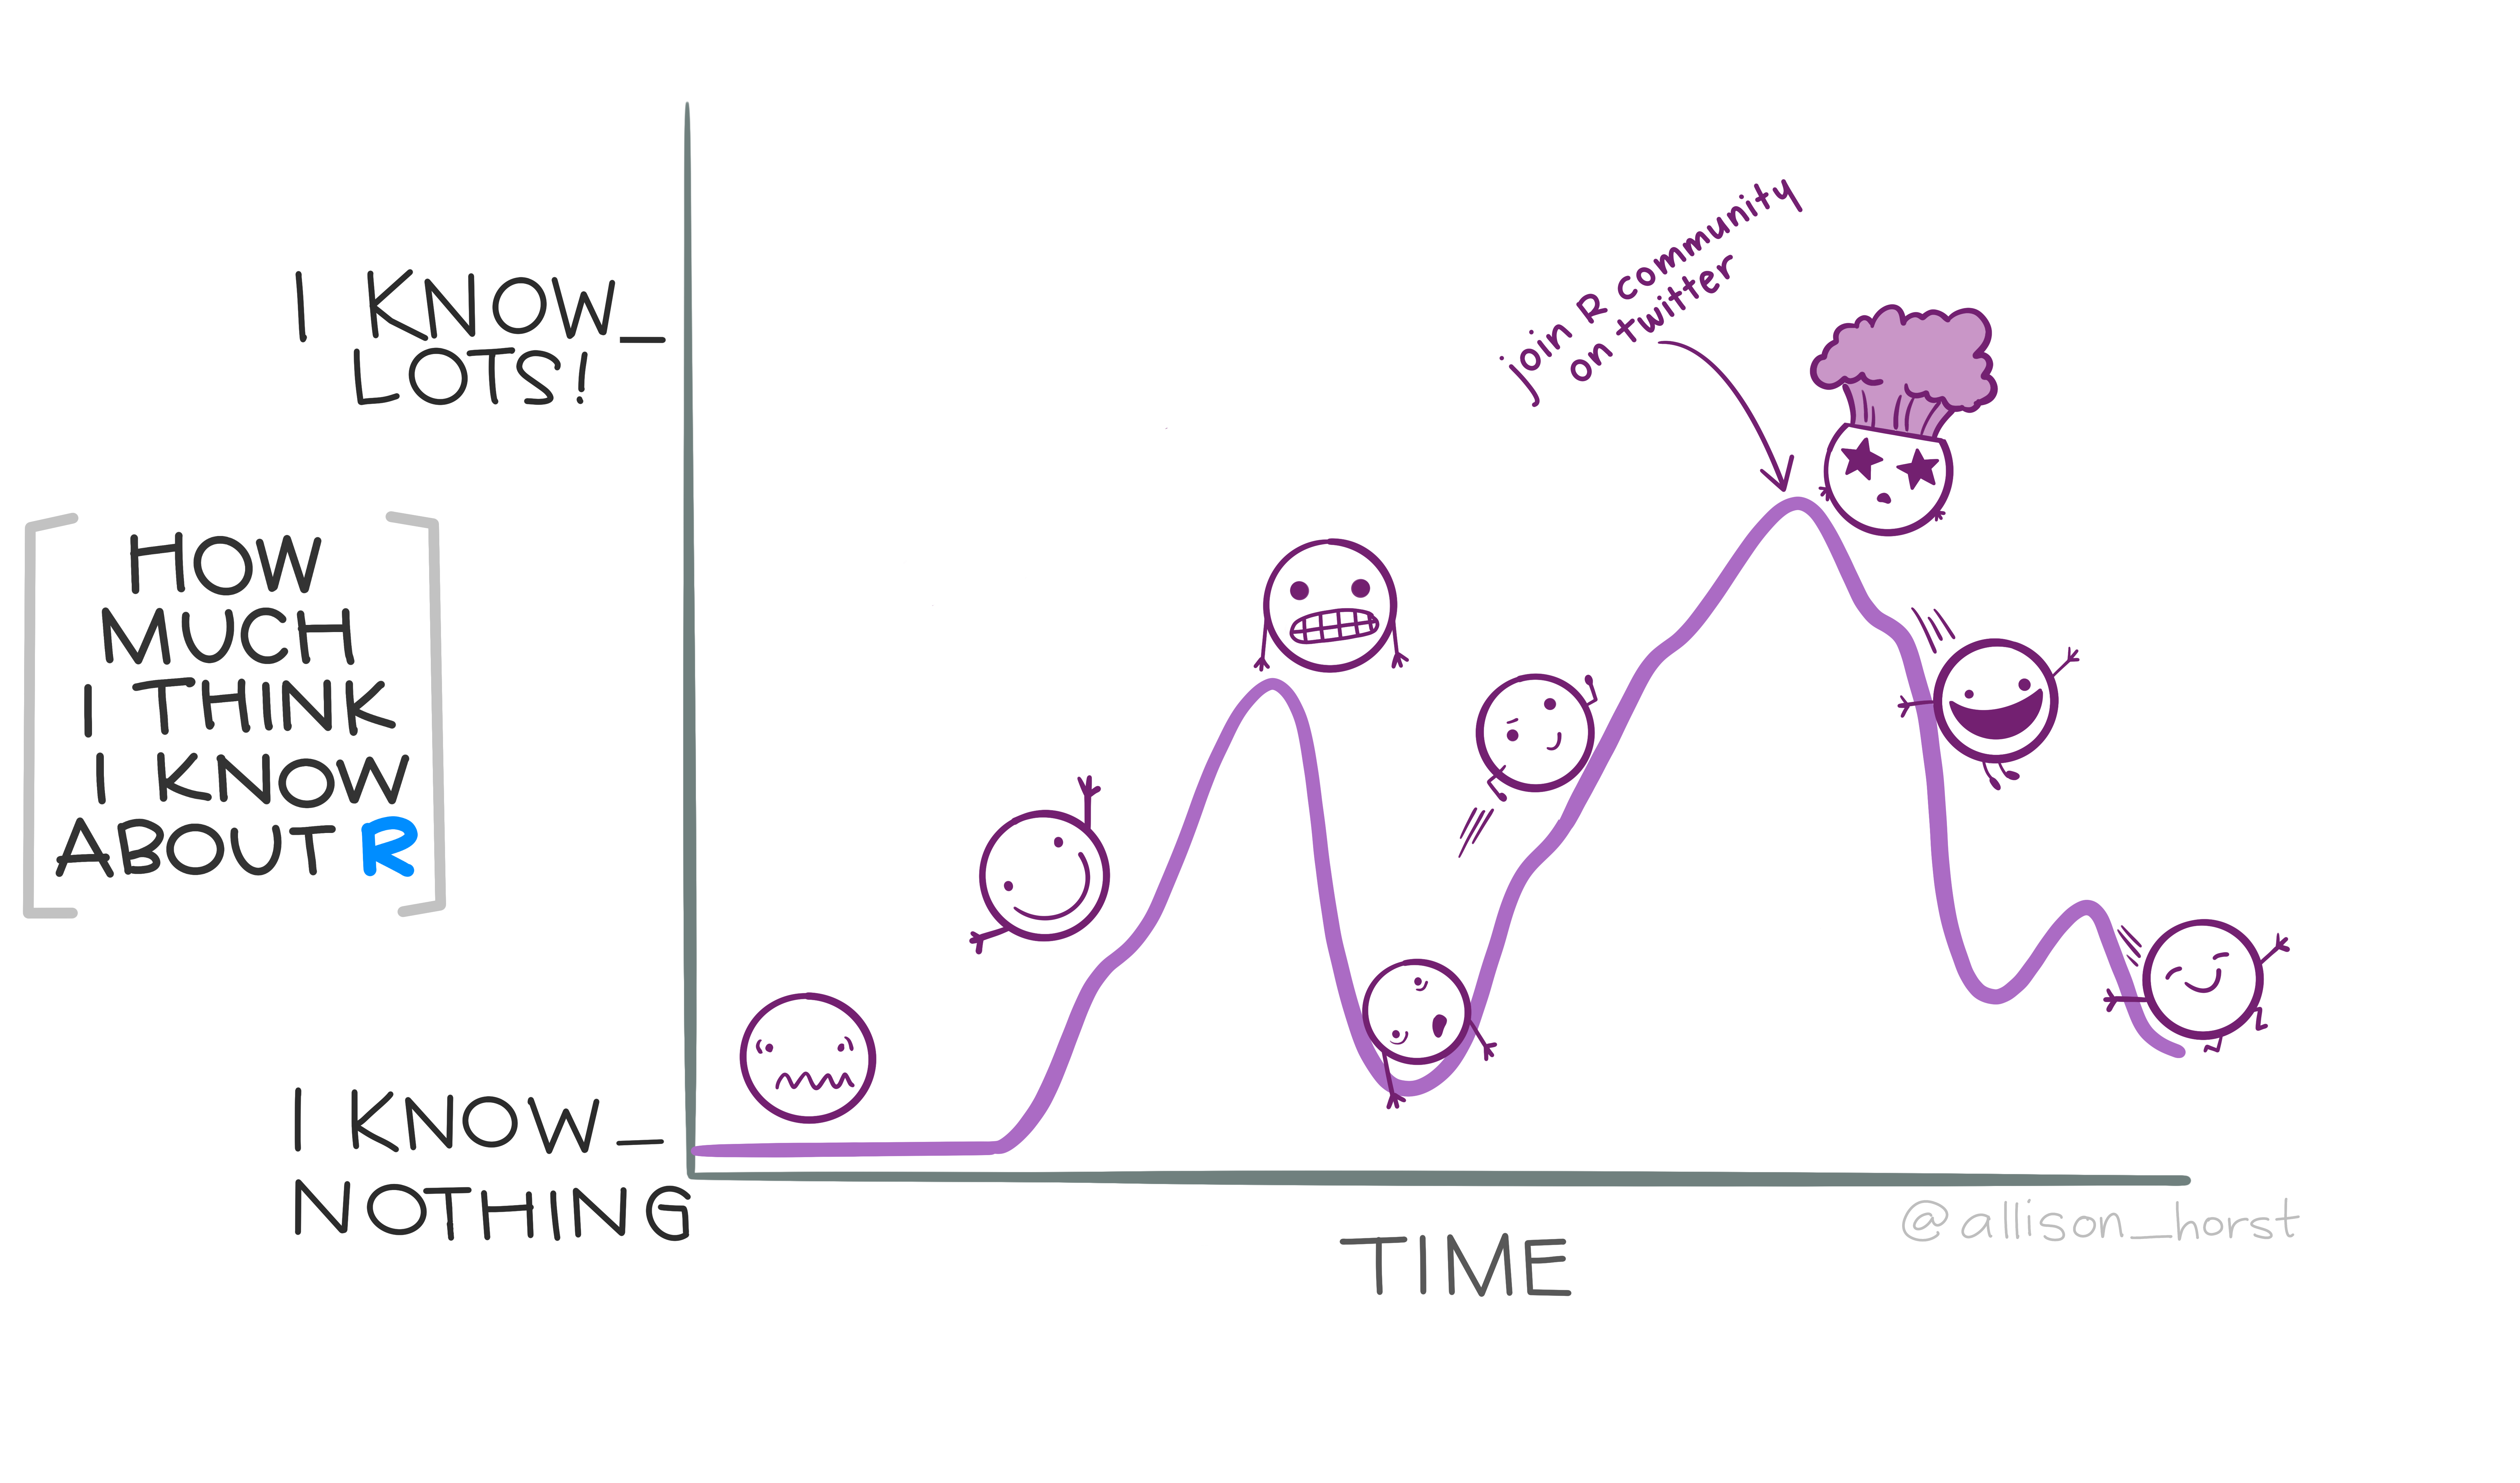
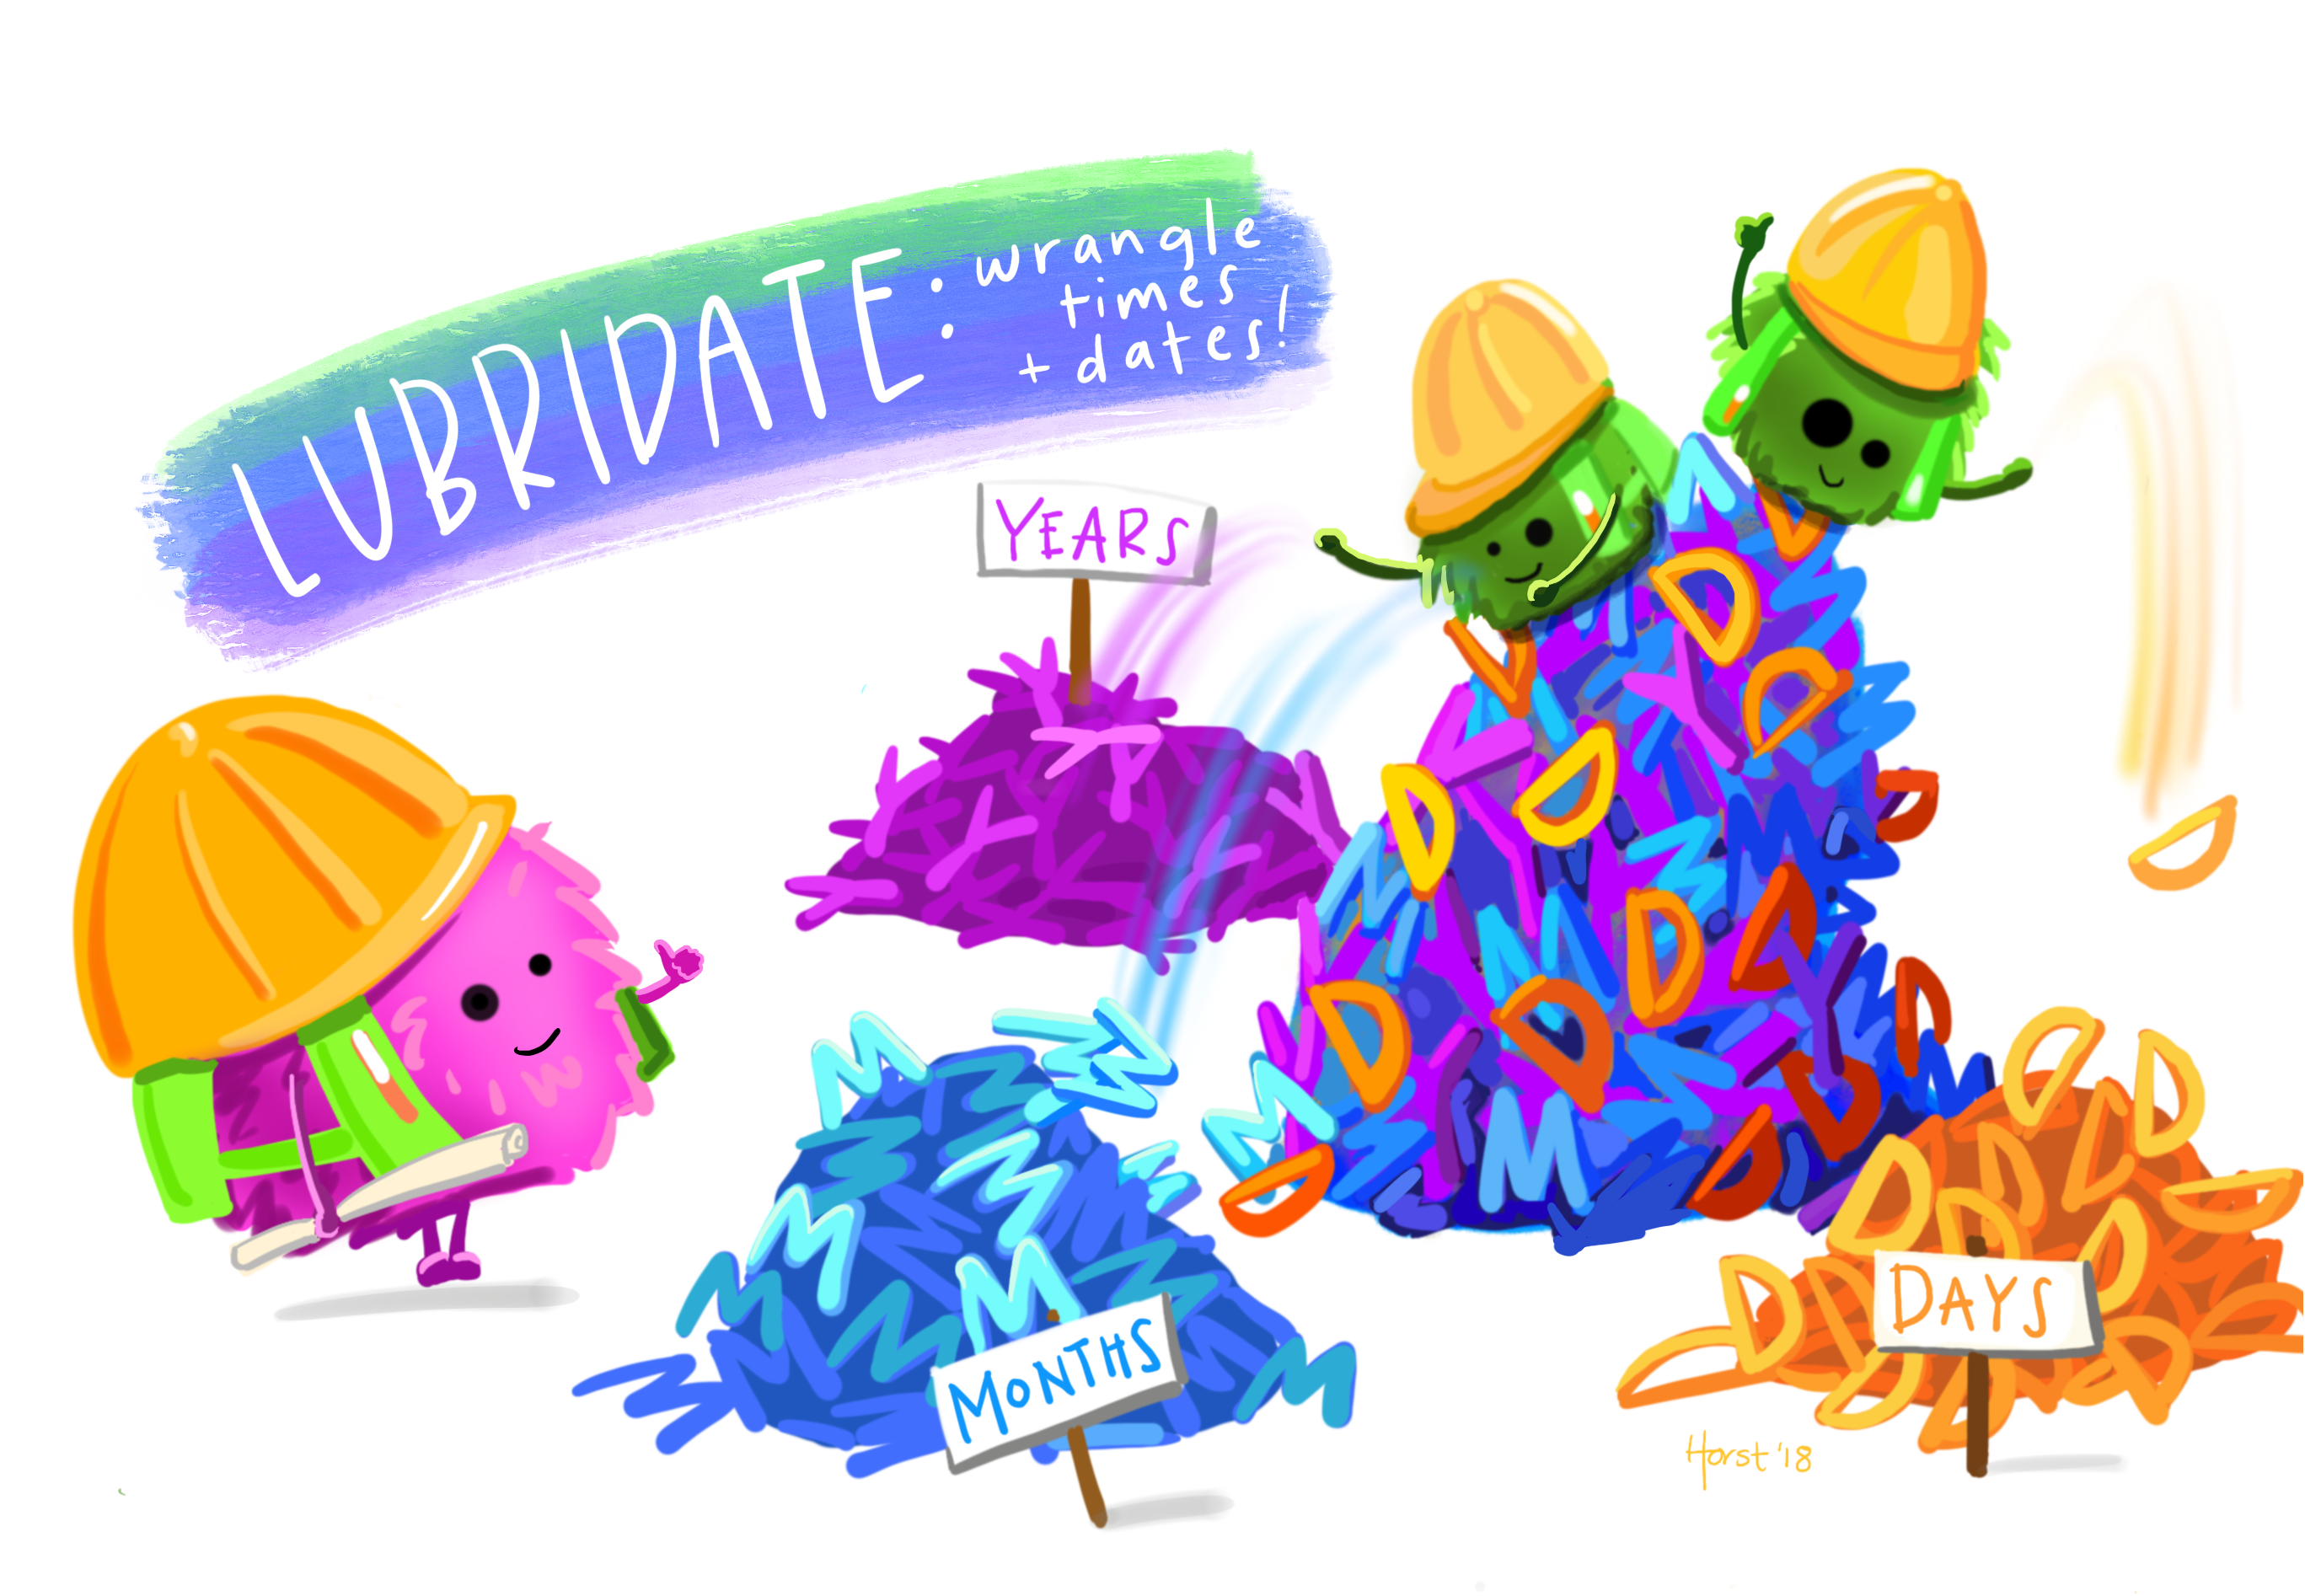
Art by Allison Horst @allison_horst So far I have learned that lubridate has some nice functions for pulling date components like day, month, or year and using them within group_by() and summarise() or ggplot(). But most of the time when I am working with date data in the real world, R doesn’t even think my dates are dates. Most of the time date data that I read into R gets parsed as characters.

lubridate month() + wday()

Art by Allison Horst @allison_horst When I am trying to work out a problem with R, I generally skip the package documentation, I avoid stack overflow, and I go straight for a blog post written by someone who has just learned what I am trying to learn. I think when you have just learned something, you are in THE BEST PLACE to teach someone else. You are acutely aware of what it feels like to not “get it”.

lubridate first google

I have set myself a challenge of learning to deal with dates in R. Nothing like setting a date for an R-Ladies Sydney event where you will teach other people to spur the motivation for learning how to use the lubridate package. The plan is to learn how to use the package and document my learning process along the way so that at the end of Oct I can tell everyone…

group_by and summarise

Some students have been asking me how they can calcuate means and standard errors by condition. Here is a quick example using the palmer penguin data. Details of the palmer penguin data, with art by Allison Horst, can be found here. load packages library(palmerpenguins) library(tidyverse) read in data penguins <- penguins glimpse(penguins) ## Rows: 344 ## Columns: 8 ## $ species <fct> Adelie, Adelie, Adelie, Adelie, Adelie, Adelie, Adel… ## $ island <fct> Torgersen, Torgersen, Torgersen, Torgersen, Torgerse… ## $ bill_length_mm <dbl> 39.

calculating z scores

The scale() function will center and/or scale a numeric object. Use center = TRUE to subtract the mean from the values; use scale = TRUE to divide the centered values by the standard deviation to produce z scores. center variable A scale(A, center = TRUE, scale = FALSE) generate z-scores for variable A scale(A, center = TRUE, scale = TRUE) Lets try it with EMG data