ggplot tricks

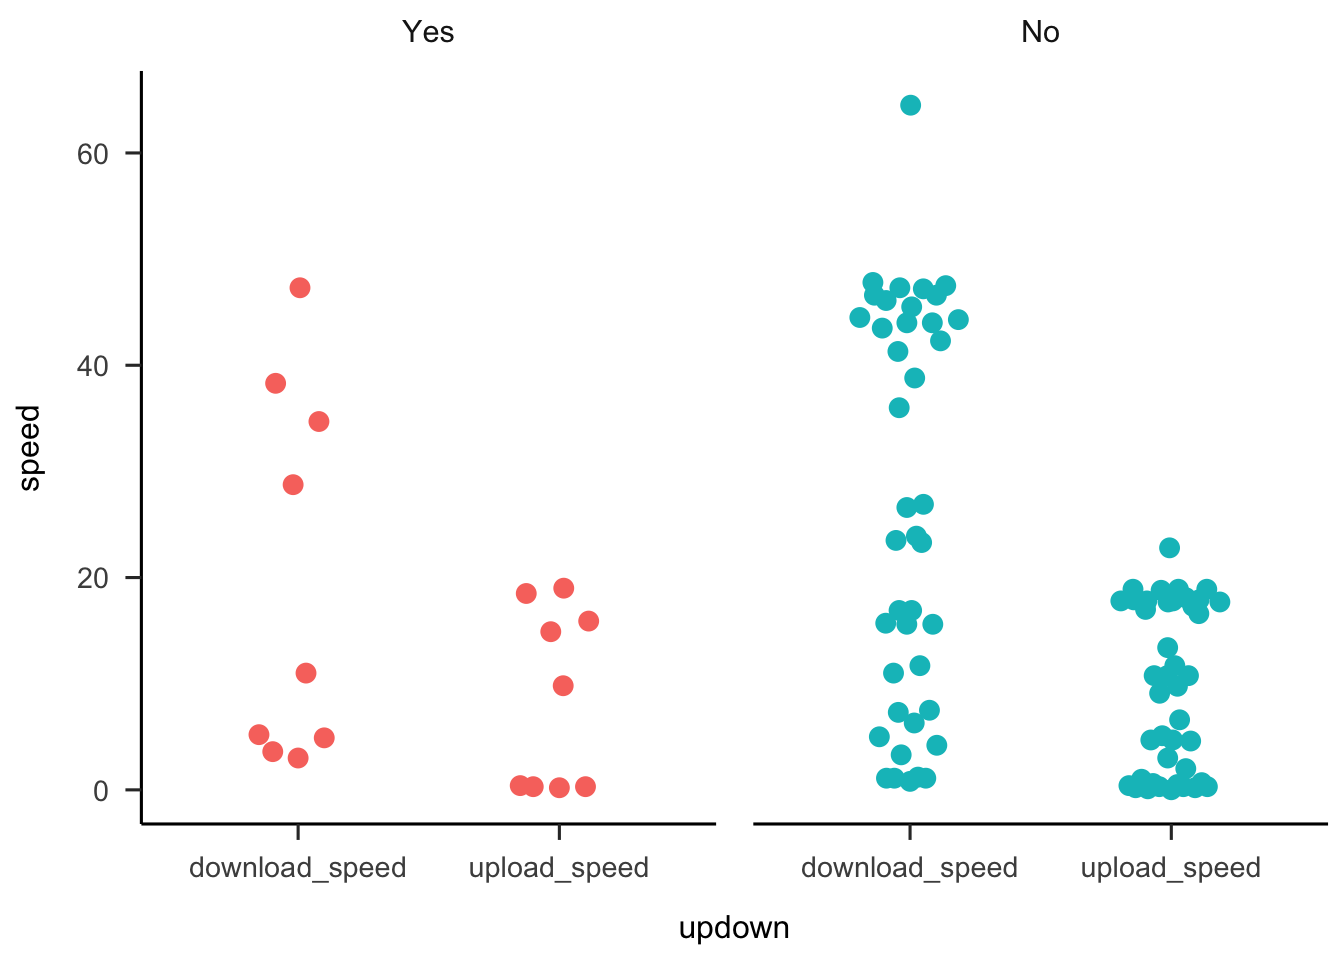
Here are some ggplot tricks that I shared at the R-Ladies Sydney June Show and Tell. Why is my internet speed so terrible? Working from home and pivoting to teaching online has made me realise that my wifi connection is really bad, particularly when it rains. I have been teaching new honours students R and needed a little dataset to demo how to get data into R, so made a google form and put it out on twitter to confirm to myself that my connection really is worse than most other people.

July 4, 2020

Spending in COVID

There is no doubt that COVID19 has massively disrupted how we spend our time and money. In this post, I update code inspired by this R-bloggers blog to look at how much less money we have been spending on eating in the last month, compared to April 2019. Download a copy of your bank transactions in csv format. Load packages library(tidyverse) library(janitor) library(lubridate) Read in data Clean and rename, select just date, description, debit amount, add new column for class with default value = “Other”

By Jen Richmond

May 5, 2020

recoding variables

Series: IDHTG

I don’t often deal with questionnaire data in R, but Ariana and I have started trying import her qualtrics data into R and to write a script to score her measures. The first step is to recode the variables to make it possible to add up scores on subscales. load packages library(tidyverse) make a little dataframe df <- data.frame("pp_no" = 1:12, "sectionA_1" = c("Strongly Agree","Agree", "Disagree","Strongly Disagree"), "sectionA_2" = c("Strongly Agree","Agree", "Disagree","Strongly Disagree"), "sectionB_1" = c("Frequently","Sometimes", "Infrequently"), "sectionB_2" = c("Frequently","Sometimes", "Infrequently")) Option 1: use mutate() and case_when() My first intuition is to use case_when(), which I have written about before.

in dplyr

February 8, 2020

counting things

Series: IDHTG

Sometimes things that are really easy to do in excel are not so intuitive in R. Like counting things. Because most of the time I am working with data in long format, you can end up with hundreds of observations, so functions like length() aren’t useful. Today I just wanted to check how many participants were in this dataset and it took me some significant googling. load packages library(tidyverse) library(ggbeeswarm) library(janitor) create a little df df <- data.

working with factors

Series: IDHTG

I use read_csv to read data into R and it most conservatively assumes that when you have text in a variable you are dealing characters (not factors). Of course these things are often factors so you need to explicitly convert them if you want to use the factor in an analysis or have it appear the way you want in a ggplot. The forcats package will do this with as_factor